84QUALITYGOODANACOSTIA WATERSHED8 ACTIVE STATIONS · LIVEUpper AnacostiaHickey RunDC ConfluenceVan Ness · UDC

Monitoring theAnacostia.Empowering DC.

Federal sensor data, EPA lab results & AI-powered research tools — built with UDC's Water Resources Research Institute.

open_in_newLive Demo
11,329+
Records / Day
12 active USGS & EPA stations
99.9%
Platform Uptime
<5 min data refresh
25
Parameters
pH · E.coli · Flow & more
Scroll
Anacostia at Kenilworth (ANA-002)QI 7826.1°C5.9 mg/LFAIR·
Anacostia at Navy Yard (ANA-003)QI 8327.6°C mg/LGOOD·
Hickey Run at National Arboretum (HR-001)QI 8222.0°C mg/LGOOD·
Watts Branch at Minnesota Ave (WB-001)QI 7925.2°C mg/LFAIR·
Stormwater BMP - Benning Road (SW-001)QI 715.0°C6.3 mg/LFAIR·
UDC Van Ness Green Roof · GI-001QI 453.2°C0.0 mg/LPOOR·
schoolUniversity of the District of Columbia

DC's public
university for
water science.

DC's only public university and only urban land-grant institution — advancing water quality science, education, and community engagement across the Anacostia watershed.

HBCUUrban Land-GrantDC&apos;s Only Public UniversityEst. 1851
history_edu
1851
Year Founded
diversity_3
HBCU
Historically Black Univ.
location_city
#1
DC's Only Public University
water_drop
WRRI
Water Resources Res. Inst.
verifiedWhy WQIS

What makes WQIS
different.

sensors
USGS · EPA

Federal-Grade Data

Every reading comes directly from USGS NWIS and EPA Water Quality Portal — the same authoritative feeds used by federal regulators, updated every 15 minutes across all 12 watershed stations.

smart_toy
UDC WRRI

AI Research Engine

Ask plain-English questions about water trends, anomalies, and EPA compliance. The WQIS AI Agent draws on UDC research archives and 10 years of historical sensor records.

health_and_safety
Anacostia Community

Public Health Alerts

Daily Recreation Safety Index for swimming, fishing, and kayaking — updated from EPA lab results, live sensors, and Combined Sewer Overflow event flags posted in real time.

previewInside the Dashboard

Built for real science.
Designed for everyone.

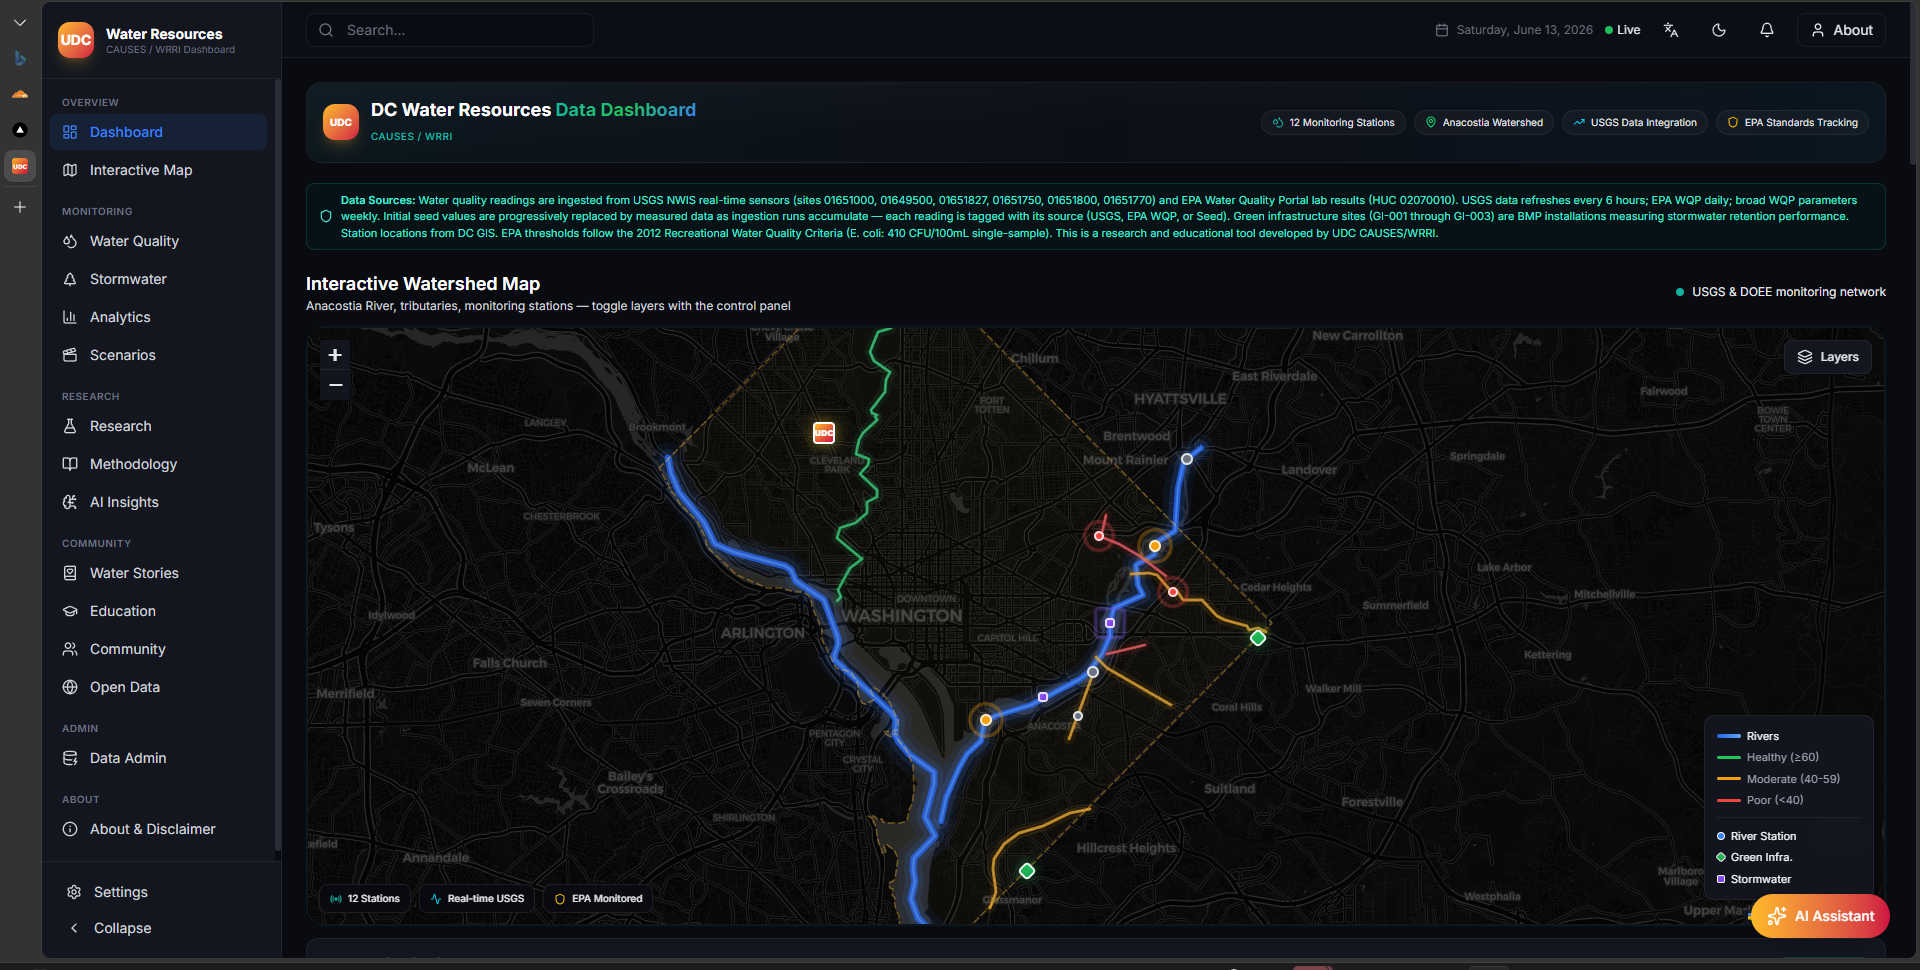
A unified interface for monitoring, analyzing, and sharing Anacostia River water quality data — raw sensor feeds to AI-powered research.

lockudc.wqis-app.com
LIVE
1/4
touch_appExplore the platform
WQIS Platform · v2.1
Watershed Map
open_in_newOpen Live DashboardmailRequest Access
12
Live Stations
USGS & EPA sensor sites across the Anacostia, Potomac & Rock Creek
25
Parameters
Chemistry, biology, hydrology — pH to heavy metals to flow rate
11,329
Records / Day
Sensor data ingested every 15 minutes, every day, year-round
10+
Years of History
Historical archive available for trend analysis and research
water_drop

Ready to explore
the Anacostia?

Join UDC students, faculty, and Washington DC community members — free, open, and built for impact.